
Many of you may already use this cable for connections from your power supplies to fused distribution or even for power injection but may still be interested in the tests.
For others a little up front ramble.
In the world of 5v pixels voltage drop has always been a serious business, the 12v realm has an easier time of it but they are still not immune to the effects with things like flickering happening.
The closer you can have your pixels to the power supply or the thicker the power wire is the better it is, however DC power cable in Oz was stupidly expensive for larger sizes over 1mm sq (18awg) or hard to buy.
With the explosion of solar panels over the years both 4mm sq and 6mm sq DC twin core cable is used extensively in the industry. doesn't mean it's got easier to buy locally or sellers want stupid prices for it.
Not being able to just walk into Bunnings to buy it generally pushes it off peoples list, however it can be found now from various sites, it's still going to cost you close to $2/M or cheaper if you can find deals.
The cable I got is TV1-F 4mm Twin core with red and black marking and UV rated for outdoor use. It is stranded tin coated copper.
So from the 100M drum we sliced off a metre of cable to check voltage drop against the current reading.
Some numbers:
Square mm - 4
Length tested - 1 metre
Manufacture spec for resistance - 10.18m Ohm for the loop (2M equivalent) that's milliOhm
Calculated resistance including spade connectors in circuit - 13.78 mOhm
For a current draw of 5A there was a voltage drop of 70mV / metre
That's 0.7v for 10 metres - 30ft for non metric people
It might not sound great over longer runs but it all helps and is hugely better than most commonly used cables, heck it's even better than the 6mm speaker cable i have that isn't all pure copper.
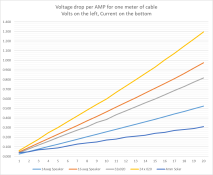
To interpret the graph, voltage drop per metre is on the left hand side and the current is the bottom axis. These are all real measurements with the same setup.
Edit 3rd Feb: the chart has been updated to include 6mm twin solar cable for comparison

Bonus material:")
The cable has a 55A in free air rating and considering it is used normally in 100's of volts systems the voltage drop per metre at 55A would be a concern but may be ok.
at 55A that the measured drop was 0.8v / metre
at 60A the drop was 0.9v / metre
For power supply to a fuse block good practice would be to do dual runs from the PSU.
Now at 60A the cable did heat up, here is a thermal image after it had been under constant load for many minutes.

Note the cable was showing 73c at this point.
Even more impressive though is the MW SE-600, 100A 5v supply suppling the power, it was showing no signs of even a warm spot
Here is the video for the testing
View: https://www.youtube.com/watch?v=KPulNehdblw
Make sure to watch the video all the way as you get to see what happens when you accidently short out the cable after we had tested.
Cheers
Phil
For others a little up front ramble.
In the world of 5v pixels voltage drop has always been a serious business, the 12v realm has an easier time of it but they are still not immune to the effects with things like flickering happening.
The closer you can have your pixels to the power supply or the thicker the power wire is the better it is, however DC power cable in Oz was stupidly expensive for larger sizes over 1mm sq (18awg) or hard to buy.
With the explosion of solar panels over the years both 4mm sq and 6mm sq DC twin core cable is used extensively in the industry. doesn't mean it's got easier to buy locally or sellers want stupid prices for it.
Not being able to just walk into Bunnings to buy it generally pushes it off peoples list, however it can be found now from various sites, it's still going to cost you close to $2/M or cheaper if you can find deals.
The cable I got is TV1-F 4mm Twin core with red and black marking and UV rated for outdoor use. It is stranded tin coated copper.
So from the 100M drum we sliced off a metre of cable to check voltage drop against the current reading.
Some numbers:
Square mm - 4
Length tested - 1 metre
Manufacture spec for resistance - 10.18m Ohm for the loop (2M equivalent) that's milliOhm
Calculated resistance including spade connectors in circuit - 13.78 mOhm
For a current draw of 5A there was a voltage drop of 70mV / metre
That's 0.7v for 10 metres - 30ft for non metric people
It might not sound great over longer runs but it all helps and is hugely better than most commonly used cables, heck it's even better than the 6mm speaker cable i have that isn't all pure copper.
To interpret the graph, voltage drop per metre is on the left hand side and the current is the bottom axis. These are all real measurements with the same setup.
Edit 3rd Feb: the chart has been updated to include 6mm twin solar cable for comparison
Bonus material:
The cable has a 55A in free air rating and considering it is used normally in 100's of volts systems the voltage drop per metre at 55A would be a concern but may be ok.
at 55A that the measured drop was 0.8v / metre
at 60A the drop was 0.9v / metre
For power supply to a fuse block good practice would be to do dual runs from the PSU.
Now at 60A the cable did heat up, here is a thermal image after it had been under constant load for many minutes.
Note the cable was showing 73c at this point.
Even more impressive though is the MW SE-600, 100A 5v supply suppling the power, it was showing no signs of even a warm spot
Here is the video for the testing
View: https://www.youtube.com/watch?v=KPulNehdblw
Make sure to watch the video all the way as you get to see what happens when you accidently short out the cable after we had tested.
Cheers
Phil
Attachments
Last edited: